HR Performance Dashboard
This use case shows how a performance dashboard makes data analysis within a company significantly easier – from consolidating scattered data to enabling fast, reliable decision-making.
The starting point: Time-consuming analysis
Previously, analysis was quite time-consuming for many employees. Data had to be gatheredfrom various systems, transparency and data quality were often unclear, and slow processesdelayed decision-making. The result: unnecessarily complex workflows, misunderstandings, and insights that arrived too late.
What does our solution look like? Role-based access delivers relevant information.
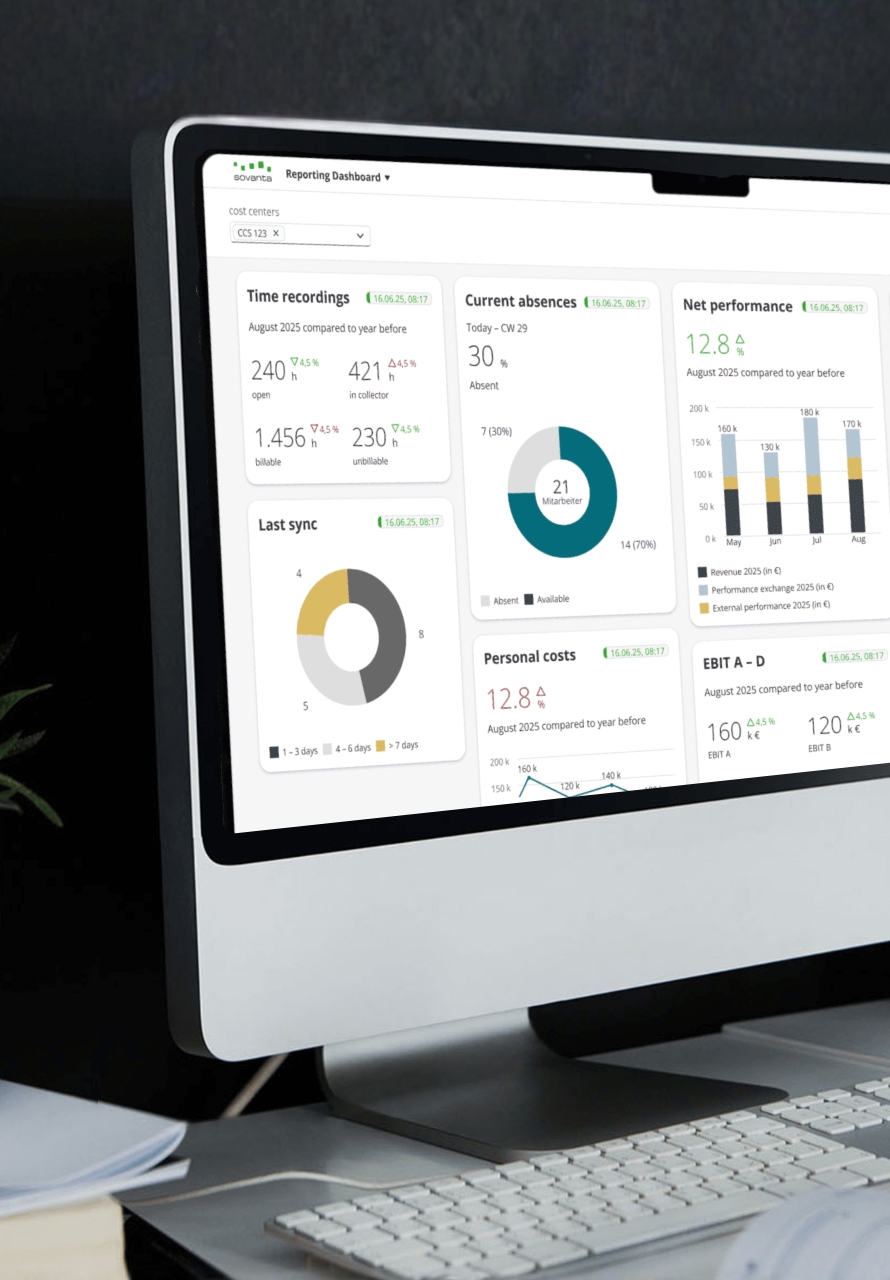
A centralized dashboard that brings together all relevant data in one place – as a clear singlesource of truth. Thanks to role-based access, each user sees exactly the information they need. Analyzing trends, comparing time periods, or evaluating KPIs can now be done in just a fewclicks – without any manual data consolidation. In three steps, this means:
- Unified Data Solution
Centralized analytics with clear and consistent KPIs reduces manual effort, eliminates transaction handling, and ensures compliance with requirements. - Role-Based Access and Data Transparency
Clear permission structures ensure that operational employees, business unit managers, and analysts only see the data relevant to them, thereby increasing transparency and control. - Single Source of Truth for Decision-Making
The dashboard consolidates all data into a single source of truth, enabling fast trend analysis and period comparisons. It replaces fragmented tools and Excel spreadsheets, providing up-to-date and reliable information for decision-making.
The result? Reduced analysis time by 97%
The Performance Dashboard reduces analysis time by 97%, consolidates fragmented processes into one streamlined solution, and enables faster, more reliable data-driven decisions through improved transparency and a single source of truth.
In concrete terms: Analysis dropped from 1.6 h to a few clicks. Data from 8 systems is now combined into one streamlined dashboard.
Do you have a similar challenge?
Would you like to see how the different services work together in this use case? Or do you have questions about the approach? Simply fill out the form and our sovanta experts will get in touch with you.